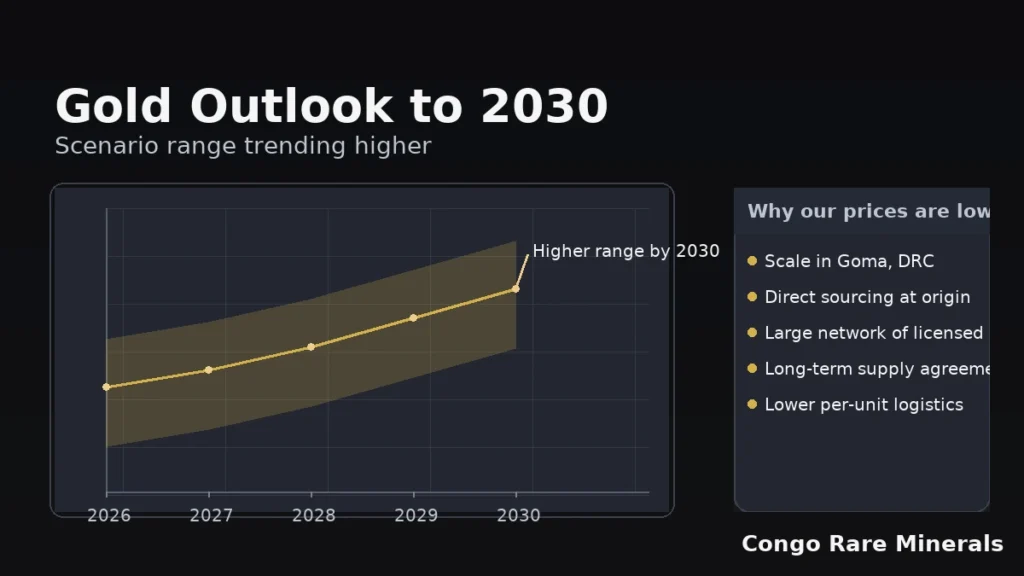
If you’re thinking long term, don’t chase a single price target. Build a plan around the forces that actually move gold: real interest rates, the dollar, central-bank buying, and risk appetite. Below is a clear view of what the big forecasters are saying today, how the macro backdrop could evolve, and practical ways to position from 2026 through 2030.
The short version
- Analyst stance (2025): Major houses turned more bullish this year as gold hit record highs. Goldman Sachs lifted its end-2025 target to $3,700/oz on sustained central-bank demand and investment flows. (Reuters)
- Demand base: Central banks bought ~1,045t in 2024 and are on pace for another heavy year in 2025, well above pre-2022 averages. That helps put a floor under prices. (World Gold Council, Reuters)
- Macro path: The IMF sees global growth near 3% with inflation cooling into 2026, implying lower policy rates but lingering uncertainty—fertile ground for strategic gold allocations. (IMF)
Where we are now (to frame 2026–2030)
- Fresh highs in 2025 drew in investment (ETF/OTC) while central-bank buying stayed strong, even as high prices squeezed jewelry demand. (Reuters, World Gold Council)
- Street forecasts shifted up: a Reuters poll moved its 2025 median forecast to about $3,220/oz, and several banks raised year-end targets. We use these as inputs, not guarantees. (Reuters)
The drivers that will set the range (2026–2030)
- Real interest rates & the dollar
Falling or negative real yields and a softer dollar support higher gold; sharp rises in real yields cap rallies. Watch policy paths in the US/EU and term premia. (IMF) - Official-sector demand
Post-2022 reserve diversification has been the standout theme. If central banks keep buying far above the old 500–600t pace, dips are likely to be bought. A slowdown would widen downside bands. (World Gold Council) - Investment flows (ETF/OTC)
Risk-off episodes, recession scares, or debt concerns can pull new capital into gold vehicles quickly (and out just as fast). (Reuters) - Supply, recycling, and premiums
Higher prices nudge more recycling; mine growth tends to be slow and capital-intensive. Tight wholesale markets can push premiums in stress periods. (World Gold Council)
Scenario map for 2026–2030 (planning ranges)
These are planning bands, not promises. Use them to size positions and set buy points.
| Scenario | Macro backdrop | What it means for gold |
|---|---|---|
| Base case | Gradual disinflation, policy rates drift down; central-bank demand stays elevated vs pre-2022 | Choppy uptrend; plan around a $3,000–$4,000 trading band with spikes on risk events |
| Upside | US/EU growth scare or debt stress; real yields fall; central-bank buying remains heavy; weaker dollar | Breakouts possible; model $4,000–$5,000 peaks during stress windows |
| Downside | Faster disinflation + rising real yields; strong dollar; official-sector demand cools | Mean reversion; prepare for $2,400–$3,000 tests before buyers step in |
Why these bands? They extend today’s forecast set (now pointing higher into late-2025) across plausible macro paths: softer real rates and steady official buying skew upside; the reverse skews down. (Reuters)
How to build a long-term plan (practical)
1) Stage your entries
Use tranches (monthly/quarterly buys) to average in across the range. Add on weakness toward the lower band; slow down as prices push the upper band.
2) Pick liquid units
Favor 1 oz coins, 100 g, 250 g, and 1 kg bars for tight spreads and easy resale. See our overview of Gold Coins vs Gold Bars.
3) Verify every time
Ask for invoices, assay cards/reports, and serial-numbered bar lists where applicable. For extra assurance, use our Lab Testing and options via Refining.
4) Store to your horizon
Home safe for small amounts, bank boxes for mid-sized holdings, professional vaults for larger bars. Our guide on How to Store Gold compares costs and access.
5) Keep exit optionality
Before you buy, confirm our current buyback spreads for your chosen units. That’s your real-world “round trip” cost if you need to sell.
Key risks to watch (and what to do)
- Sharp rise in real yields → Expect pressure; keep some cash for lower entries. (IMF)
- Central-bank buying cools → Broader ranges, slower rebounds; prioritize more liquid units. (World Gold Council)
- Policy or trade shocks → Spreads/premiums can jump; lock in written quotes with shipping and insurance spelled out (no surprises).
What we’re doing at Congo Rare Minerals
- Keeping stock in the most liquid unit sizes so you can stage buys across 2026–2030.
- Offering independent verification and clean document packs for exports.
- Helping clients match storage to their plan horizon. Start here: visit the Shop or talk to sales on Contact.
FAQ
Are bank forecasts reliable for five years out?
Useful as inputs, not as a trading signal. We blend them with macro scenarios and position in tranches. (Reuters)
If gold already hit records in 2025, is there still upside?
Yes, if real yields slide and official-sector demand stays elevated. But plan for ranges, not a straight line. (World Gold Council)
Could prices fall back below $3,000?
If disinflation outpaces expectations and the dollar strengthens, it’s possible. That’s why we size buys and keep cash for lower bands. (IMF)

