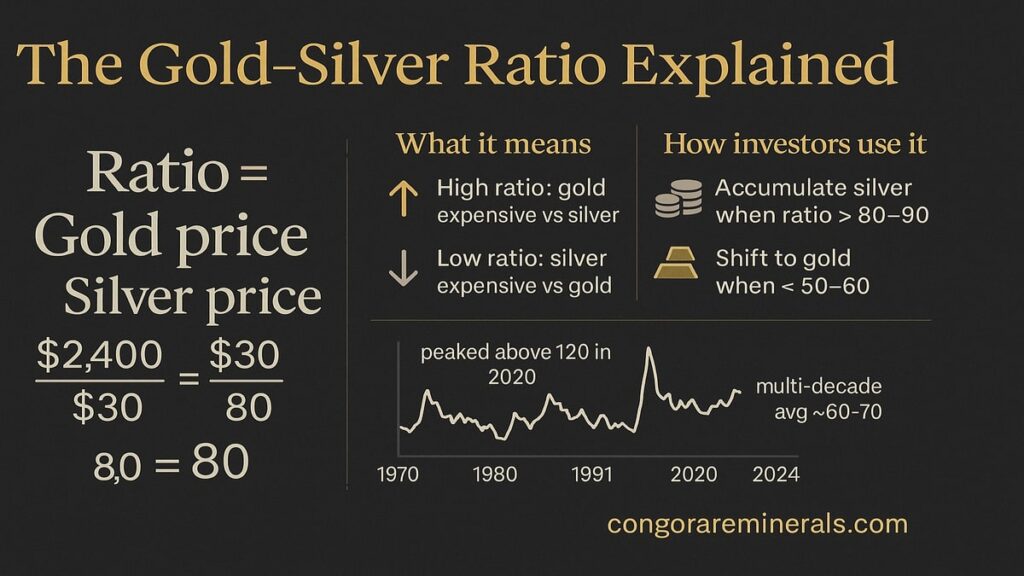
Traders watch the gold–silver ratio because it shows how many ounces of silver it takes to buy one ounce of gold. It is a simple line that helps you judge relative value, not just price levels.
The short version
- Ratio = Gold price ÷ Silver price.
- High ratio means gold is expensive relative to silver. Many traders tilt toward silver.
- Low ratio means gold is cheap relative to silver. Many traders tilt toward gold.
- It is a signal, not a guarantee. Use it with position sizing, not as a stand-alone bet.
How to read it in 30 seconds
| Ratio zone | What it suggests | Typical move for value seekers | What to watch |
|---|---|---|---|
| High (e.g., 80–100+) | Gold rich vs silver | Add silver, trim gold | Recession risk, weak industry demand can keep silver soft |
| Middle (e.g., 60–80) | Neutral zone | Hold base mix | Macro data, yields, USD moves |
| Low (e.g., 40–60 or below) | Gold cheap vs silver | Add gold, trim silver | Surging industry demand can keep silver strong |
Examples are illustrative. Markets shift. Always check current prices.
How traders actually use it
- Relative value tilt
Keep a base allocation, then lean toward the cheaper metal when the ratio stretches. Example: base 80% gold, 20% silver. If the ratio spikes high, lift silver to 30% and ease gold to 70%. - Pair ideas
Paper traders may go long the cheaper metal and short the richer one. Physical buyers usually avoid shorting and simply adjust new purchases. - Reversion mindset
The ratio can wander for years. Treat it as a guide to where value might be, not when it turns.
Why the ratio moves
- Macro growth and industry demand. Silver has large industrial use, so booms can pull the ratio lower.
- Safe-haven flows. Stress often favors gold first, pushing the ratio higher.
- Yields and the dollar. Rising real yields and a firm USD can pressure both metals but not equally.
- Supply shifts. Mining and refining changes can nudge relative pricing.
A quick calculator you can use
- If gold is $2,400/oz and silver is $30/oz, the ratio is 80.
- If gold is $2,200/oz and silver is $44/oz, the ratio is 50.
You do not need a complicated model. Update the math, then decide whether to tilt your next purchase.
Playbooks for physical buyers
Conservative allocator
- Keep a core like 85% gold / 15% silver.
- Only tilt when the ratio is very high or very low.
- Unit choices: 1 oz coins and 100 g bars for flexibility.
Balanced accumulator
- Base 70% gold / 30% silver.
- When the ratio rises into a high zone, shift new buys toward silver until you are back at target.
- Use 100–250 g gold bars and 1 oz silver coins for easy rebalancing.
Opportunistic buyer
- Build in tranches.
- Buy more of the cheaper metal on ratio extremes, then normalize as it moves back to the middle.
- Consider 1 kg gold bars for low premiums if your ticket size is large, and keep a sleeve of smaller units for partial sales.
Common mistakes
- Treating the ratio like a precise timing tool. It is not.
- Going all in on silver because the ratio is high, then discovering industrial demand is weak.
- Ignoring storage. Silver takes far more space per dollar of value than gold.
- Forgetting premiums and exit logistics. Unit sizes and documents drive resale.
Practical tips for execution
- Plan exits upfront. If you expect to sell in pieces, hold some 1 oz coins and 100 g bars even when you buy larger bars for cost efficiency.
- Keep documents tidy. Invoice, assay, certificate of origin where applicable, insurance and shipping papers, and a serial-numbered bar list for larger bars.
- Use tranches. Spread purchases across dates to reduce regret if prices swing.
- Mind currency. If you earn in EUR or UGX but pay USD, review your plan when the dollar swings. See our guide on Gold and the US Dollar for simple hedging ideas.
How Congo Rare Minerals helps
- 22K and 24K products with a 100 g minimum.
- Insured export to approved destinations and a clean document pack for resale.
- Verification support at your nominated refinery when required.
- Guidance on unit mix so premiums stay low and exits stay smooth.
Ready to act
- Shop: /shop/
- Lab Testing and verification: /lab-testing/
- Refining and documentation: /service/refining/
- Talk to sales: /contact-us/

